|
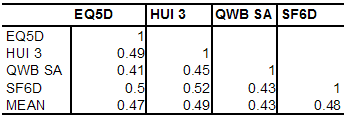
MAU instruments have been validated primarily by correlating them with other disease specific or generic QoL instruments (convergent validity) or demonstrating that they discriminate between populations of well and ill persons. These are weak forms of content validation except in the specific context for which the other instrument has been validated (see Does correlation demonstrate validity). Even in this context the test is necessary but not sufficient for validation as a QALY (see Necessary and sufficient conditions for QALY validation). Evidence indicates that the necessary condition of convergent validity is not well met by existing MAU scales. Results in Box 3 indicate that, in the only two 5 instrument studies conducted to date, instruments explained only 41 to 64 percent of other instruments variance (R2). This is much less than would be expected for instruments measuring the same property. Two scales measuring weight would not be considered valid if the correlation between them was as low as indicated in these tables. Box 3 Empirical results from two 5 instrument comparative studiesHawthorne, Richardson and Day (2001) Five instruments were administered to 396 members of the community, 334 hospital outpatients and 226 hospital inpatients. Response rates were 58, 43 and 68 percent respectively. The percentage of each instrument’s variation explained by each of the other instruments (R2) is shown in Table 1. Table 1 Proportion of variance explained by another instrument (R2) 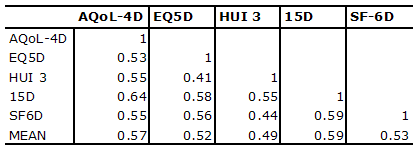
R2 = correlation coefficient squared
Fryback, Palta, et al (2010) Data were obtained from the National Health Measurement Study from 3844 US adults for 5 instruments. Results below were derived from reported correlations. The HUI 2 is omitted as the HUI 3 obtained similar or higher correlations with other instruments. Table 2 Proportion of variance explained by another instrument (R2)
Source: Fryback, Palta et al. (2010) p4 |
|