Validation
In principle, the concept of ‘validity’ is straight forward. What is validity? A valid instrument measures what it purports to measure. A correctly calibrated ruler, for example, gives valid measurement of distance. In practice, validation is a complex subject. It is discussed in most textbooks concerned with instrument construction. For a simple but comprehensive explanation see the excellent web-based notes by William Trochim http://www.socialresearchmethods.net/kb/measval.php
The present notes focus primarily upon validity of multi-attribute utility (MAU) instruments. This context adds two additional layers of complexity. The first is attributable to the breadth of the concept. Health is multi-dimensional and overall validity requires validity in all dimensions. Secondly, to qualify as ‘utility’, in the sense used by health economists, additional properties are required to those usually discussed in the psychometrics (link) literature.
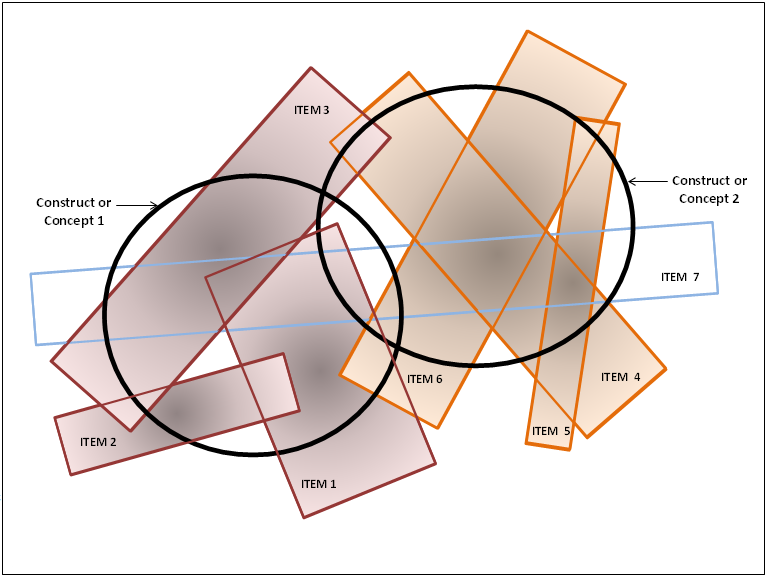
With psychological constructs such as intelligence (IQ) or quality of life (QoL), establishing validity is problematical as there is no ‘gold standard’ as there is for physical measurement (see ‘What is a ‘gold standard’). A concept such as intelligence, is commonly the result of a number of elements: verbal, numerical, spatial skills, problem solving, memory, etc. In turn, each of these may not be clearly identified by the answer to a simple question, but may require a series of questions and answers. Further, the precise meaning of terms and questions can vary between individuals and cultures in a way which is related to personal circumstances. As an example ‘communication’ may mean speaking to some, signing to others, face to face contact for some or texting for others. To overcome this problem psychometric theory uses some variant of factor analysis to create measurement instruments. Answers to questions are analysed for their relationship and answers which cluster around a concept – the answers correlate – are accepted as a measure of this concept. This is illustrated in Figure 1 in which two constructs or concepts are represented in ‘content space’ by the heavy bold circles. A series of questions and answers are represented by the various rectangles. As shown, three of these heavily overlap Concept 1 and 3 overlap Concept 2. A seventh item, Item 7, crosses both concepts. In the terminology of factor analysis this last item ‘cross loads’ on the two concepts and would normally be eliminated from the items used in an instrument. Figure 1
Key:
Figure 1 illustrates a number of points. Concepts overlap. Statements overlap and do not exactly correspond with concepts. Importantly, single statements may cover only a small part of the content of a concept, ie language and concepts are imperfectly related. Finally, as shown, neither concept may be perfectly defined by the items. Some content may be omitted by the item description.
Validation is a process of hypothesis testing: increasing the confidence we have in a scale and confidence in the inferences drawn from it. This implies that an instrument is never (fully) validated: we have more or less confidence in it. Importantly, the more demanding the test the greater the confidence. The less demanding the test the less the confidence. In the absence of a gold standard, validation of a construct (construct validity) usually refers to content, concurrent or predictive validity. As described by Streiner and Norman (2003): ‘A measure that includes a more representative sample of the target behaviour lends itself to more accurate inferences; that is inferences which hold true under a wider range of circumstances. If there are important aspects of the outcome that are missed by the scale, then we are likely to make some inferences which will prove to be wrong; our inferences (not the instrument) are invalid.’ Page 1751. This implies that validation in Context A does not necessarily mean validation in Context B. A test of hearing amongst the general population may capture the ability to communicate. But the same test would be invalid in the deaf community which uses signing.
Brevity is not always a virtue. Adopting a ‘parsimonious instrument’ which attempts to measure both dimensions in Figure 1 with a single item – item 7 – will often result in data which correlate with the true value of both dimensions. However the correlation does not indicate content validity (see Does Correlation Demonstrate Validity). Outcomes may occur which do not affect item 7. The same conclusion is true within a dimension. Item 6 may accurately measure some changes within dimension 2 but not those described by item 4. (For example, the ability to run 100 metres does not measure dexterity, flexibility or physical endurance all of which contribute to the concept of physical fitness.) Similarly the absence of depression does not indicate good mental health as this concept includes self esteem, good life satisfaction, normal anger, good sleep and other sub-dimensions which are imperfectly correlated. Following from this it is likely that the more questions used, the greater the probability of fully capturing a concept but, as shown in Figure 1, this will result in significant overlap and ‘structural redundancy’. In the context of MAU instruments this will result in the double counting of disutility.
The types of validation tests have been categorised under different headings. These include face validity, content, predictive, convergent and discriminant validity (skeletal definitions are given in Box 2). These tests are commonly classified further. Face and content validity are often described as a sub-set of construct validity (literally the validity of the psychological construct). Predictive and concurrent validity are sometimes classified as ‘criterion related validity’. For detailed discussion see any relevant text or William Trochim’s website. http://www.socialresearchmethods.net/kb/measval.php
Box 2 ‘Validity’ would be better described as “degrees of confidence”. The labels described below do not indicate different endpoints but are derived from the different tests or reasons which have been used to increase confidence that the inferences made from an instrument score will be correct. Restated, each of the types of validity provides a different reason why we should (or should not) have confidence in the conclusions drawn from an instrument score. Types of validity:
Translation or representation validity: A general term for the extent to which a construct (concept) can be successfully translated into, or represented by, specific tests. Face validity: The instrument seems, at face value, to capture the construct, for example, by naming it. This is generally considered the weakest form of test. For example, asking ‘are you good at arithmetic’ with a response scale from very good to very bad is not likely to produce an accurate scale. Content validity: The extent to which an instrument includes or covers a representative sample of the construct’s behaviour domain, for example, determining arithmetic skill by asking for the answers to 3-4 questions for each domain of arithmetic – addition, subtraction, multiplication, division, fractions, decimals, etc. Examples of (context specific) content invalidity are given in 2 case studies in Box 4 ‘Why do MAU instruments have a low correlation’ Construct validity: A general term for the success of a test or instrument in measuring a construct (concept). It commonly subsumes the convergent and discriminant validity. Criterion validity: A general term for the use of some external criterion to test the concept. Convergent validity: A specific test of construct or criterion validity. Instrument scores correlated, as predicted, with other instrument scores or some criterion score which are known to correlate with the construct. For example the HUI 3 MAU instrument correlates with the EQ5D. Discriminant validity: Another specific test of content or criterion validity. Instrument scores do not correlate with instrument scores unrelated to the construct. For example a QoL EQ5D scores would be expected to have low or no correlation with a person’s blood pressure. Concurrent validity: An instrument can distinguish, as expected, between groups, for example, the general population and hospital patients. Predictive validity: The ability to predict what is expected. This includes the predictive tests above but is more general. For example an IQ test may predict subsequent income.
Some Common Issues
Face validity is the assessment of whether or not a test seems OK. Or (subjectively) whether it ‘should be valid’, possibly as a result of an analysis of the meaning of the words used. Questions of the form ‘how good are you at arithmetic’ or ‘do you suffer from depression’ represent weak tests of validity. Answers may be correct but they may easily be wrong if people only partially understand the implications of the concept or (consciously or unconsciously) deny or exaggerate the truth. A better test of depression would ask unthreatening questions about behaviour which covered each of the major symptoms of depression – sadness, pessimism, guilt, tiredness, lack of energy, poor sleep, etc. This would increase confidence in content validity. The Beck Depression Inventory asks 21 such questions without mentioning ‘depression’. The McGill Pain Inventory isolates 20 possible facets of pain quality also without mentioning pain, its intensity or duration.
Most broad concepts relating to health have multiple sub-domains and the need for multiple questions may follow from this if content validity is to be achieved. The use of simple questions to measure a broad dimension may have face validity. Face validity is, however, unlikely to ensure content validity.
Validity has been largely tested in the literature by convergent validity – a correlation between an instrument and a second ‘validated’ instrument. This is necessary but not sufficient for a satisfactory instrument (even if the second instrument is truly valid). An instrument with poor construct validity may simultaneously correlate highly with another (criterion) instrument. Two cases are illustrated below.
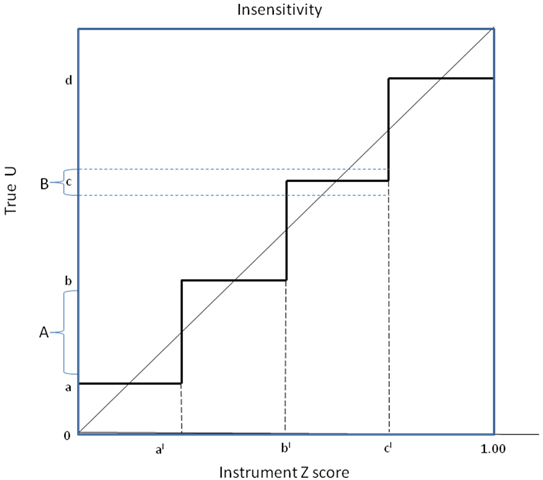
Insensitivity: In the first case, insensitivity (strictly a subset of content invalidity) may occur when there are insufficient items in an instrument or too few categories to fully capture a dimension affect. In Figure 2 true utility (True U) on the vertical axis will be recorded by instrument Z on the horizontal axis as 0.0 until it reaches a ‘switch point’ of ‘a’ when the average recorded response becomes ‘al’. True utility must rise to ‘b’ before recorded utility switches to bl, etc. As a result, a program which increases true utility by an amount ‘A’ will record no change on instrument Z. Conversely, a program increasing utility by a smaller amount, B, will result in a large recorded increase in utility from ‘bl’ to ‘cl’. Importantly, a validation study measuring both true and recorded utility (points along the step function) would produce a high correlation.
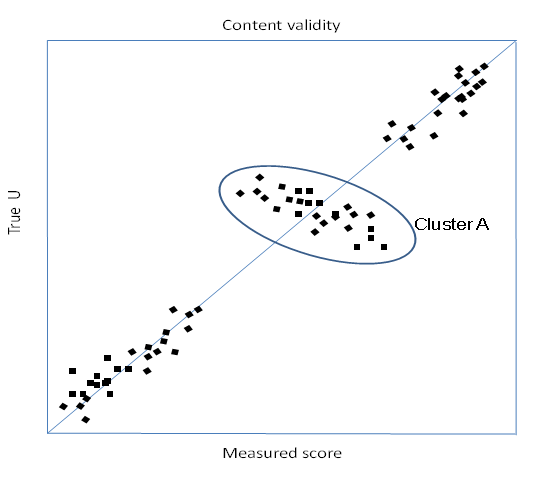
Figure 3 Construct validity
To illustrate these figures consider a mobility instrument consisting of three questions. (i) I have no pain (ii) I have mild pain (iii) I have extreme pain This instrument would produce a significant correlation with a validated pain instrument as the two responses would each attract the patients closest to it. Despite the high correlation the item clearly lacks sensitivity to gradations and types of pain (content invalidity).
Economics and psychology follow different measurement traditions reflecting the different problems they tackle and the different types of data available. The two disciplines overlap in the area of MAU instrument construction and this is potentially a source of confusion.
A third tradition – decision analysis – is also closely related to MAU instrument construction and sits between the economics and psychometrics traditions. DA: The objective of DA is to guide decision makers by determining the value (utility) of each of the multiple options available. It does so by breaking down the final decision into the multiple attributes (dimensions) which make up the decision. The choice of a location for a factory, for example, depends upon the local cost of labour and capital and the distance to the market. PI: Psychometric instruments are used to place a value (‘utility’) upon psychological states. They do so by breaking down and valuing the dimensions/elements of the state. The utility of different states guides decision making.
Elements DA: The elements which combine to determine the options are often objective and generally orthogonal – unrelated to each other. The options for the location of a car factory, in the example above, depend upon largely independent attributes – distance to the market, unit cost and productivity of capital, unit cost and productivity of labour, local entrepreneurial skill, industrial relations, political conditions, etc. Decision analysts strive to achieve a decision model with such orthogonal elements.
Combining Elements DA: Importance – ‘utility’ – weights are employed to model the overall score. In the simplest case an additive model uses weights summing to unity. PI: In principle, variable weights could be used to sum elements as in DA. In practice, they are seldom employed and scores are calculated using the same ‘unitary’ weights for all responses (which is described as ‘unweighted’). For example, with 5 ranked response categories where best = 5 and worst = 1, a person ticking the third response category would have ‘3’ added to their ‘utility’ (score).
MAU instruments are, in effect, a special application of DA methods aimed at guiding decisions by determining the utility of each of the multiple health states. The distinguishing feature of MAU instruments is that the dimensions of health are generally not independent and the dimensions are not observed and objective, but are constructs. This has three implications: (i) The dimensions should have construct validity;
Validating MAU instruments
Validation is a complex issue (see What is Validation). The validity of an MAU instrument requires four types of achievable evidence. These relate to: (i) The instrument descriptive system or questionnaire. Importantly, content validity may be context specific. (ii) The instrument model: does the model which combines items achieve criterion validity: does it result in the same utility prediction as the holistic measurement of the same health state using the same utility scaling instrument. (iii) The measurement of utility: does the scaling instrument (SG, TTO, etc) measure what we want to measure (see Validating utility). (iv) The instrument utility scores: Does the instrument produce scores with predictive and convergent validity (correlate with other ‘validated’ scales)? Again, the answer may be context specific as with the scores from other QoL instruments.
To achieve gold standard validation of an MAU instrument each of the necessary conditions above must be met. However, to interpret the final numbers as utilities which are suitable for calculating QALYs also requires the achievement of the 2 conditions below. Each is an arithmetic consequence of the definition of a QALY as ‘QALYs = (length of life)x(utility of life) where length may be discounted for time preference. (v) Evidence of a scale ‘interval property’ with respect to preferences. This means for example that any 0.2 interval along the scale (eg 0.3-0.5; or 0.6-0.8) would have the same meaning with respect to the preferred trade-off between life and death. (vi) The strong interval property. Percentage changes in utilities from an MAU instrument should correspond with the percentage changes in the expected length of life in decisions actually made when a trade-off is possible between the length and quality of life. For a discussion of the strong interval property see Richardson Working Paper 5 (1990) Cost Utility Analysis: What Should be Measured (also published in Social Science & Medicine (1994)). For practical reasons evidence with respect to the last two criteria would be hard, though not impossible to obtain. The criterion remains virtually unmentioned in the literature. A review of this reveals that, to date, the majority of validation studies are concerned with convergent validity, ie the correlation of instrument scores with non utility, disease specific instruments or correlation with other utility instruments which have been similarly validated! There has been little attention given to the other requirements above. The AQoL is the only instrument whose descriptive system was constructed using the psychometric principles of instrument construction designed to obtain content validity.
(See "How is an MAU instrument validated?".) In sum, this involves 4 separate issues:
The claim that an instrument ‘has been validated’ generally rests upon context specific tests of the second property. However correlations found in these studies do not represent strong evidence of general validity (see Does correlation demonstrate validity). The low correlation between the major MAU scales in use demonstrates that some or most or all lack content validity across all contexts.
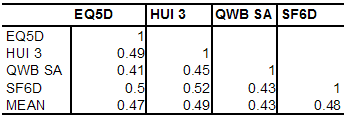
MAU instruments have been validated primarily by correlating them with other disease specific or generic QoL instruments (convergent validity) or demonstrating that they discriminate between populations of well and ill persons. These are weak forms of content validation except in the specific context for which the other instrument has been validated (see Does correlation demonstrate validity). Even in this context the test is necessary but not sufficient for validation as a QALY (see Necessary and sufficient conditions for QALY validation). Evidence indicates that the necessary condition of convergent validity is not well met by existing MAU scales. Results in Box 3 indicate that, in the only two 5 instrument studies conducted to date, instruments explained only 41 to 64 percent of other instruments variance (R2). This is much less than would be expected for instruments measuring the same property. Two scales measuring weight would not be considered valid if the correlation between them was as low as indicated in these tables. Box 3 Empirical results from two 5 instrument comparative studiesHawthorne, Richardson and Day (2001) Five instruments were administered to 396 members of the community, 334 hospital outpatients and 226 hospital inpatients. Response rates were 58, 43 and 68 percent respectively. The percentage of each instrument’s variation explained by each of the other instruments (R2) is shown in Table 1. Table 1 Proportion of variance explained by another instrument (R2) 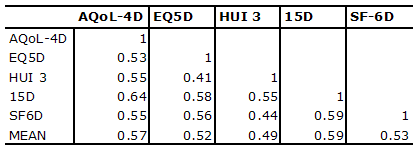
R2 = correlation coefficient squared
Fryback, Palta, et al (2010) Data were obtained from the National Health Measurement Study from 3844 US adults for 5 instruments. Results below were derived from reported correlations. The HUI 2 is omitted as the HUI 3 obtained similar or higher correlations with other instruments. Table 2 Proportion of variance explained by another instrument (R2)
Source: Fryback, Palta et al. (2010) p4
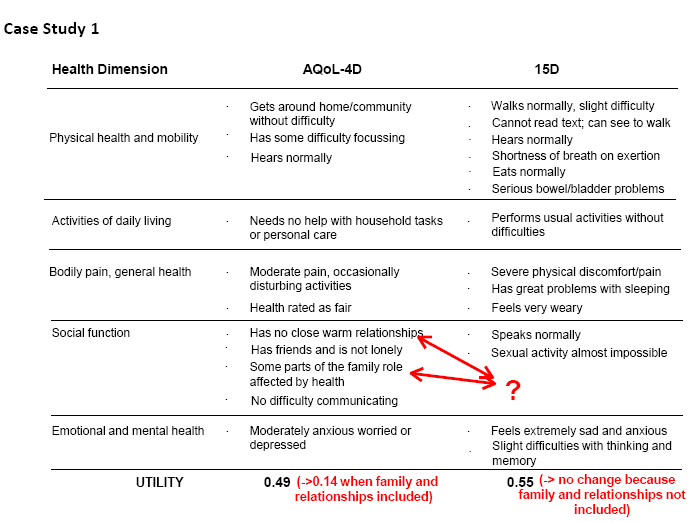
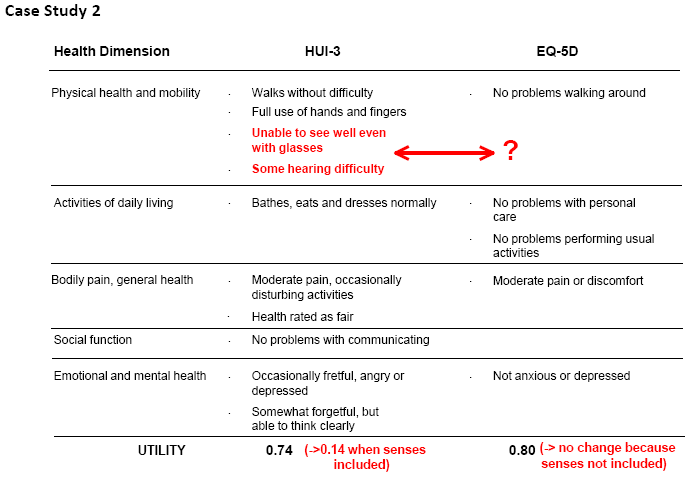
The construction of existing MAU instruments differs in virtually all respects. The economics literature has focused upon the importance of scaling instruments – the choice of TTO, SG, PTO or VAS for assigning utilities. However it has never been shown that these would cause the discrepancies in utility scores observed between instruments. Indeed, preliminary work with AQoL-8D demonstrates a much higher correlation between scores from the unweighted AQoL and its utility scores than have been obtained by correlating different MAU instruments. This suggests that differences are attributable more to the content of the descriptive systems (content validity) than to the method of evaluating utilities. Two supporting examples are given in Case Studies 1 and 2 below. Box 4 Case Studies of Content Invalidity
(click images for full size pictures) In each case study, a score for a single individual was obtained from each of two instruments whose content is described in the figures. The number without brackets in the final row reports the scores obtained from the two instruments. In Case Study 1 the same individual obtained a score of 0.14 and 0.55 on the AQoL and 15D respectively. In Case Study 2 one individual obtained a score of 0.14 and 0.80 on the HUI 3 and EQ5D respectively. The number in brackets reports the score which would have been obtained if the instrument yielding the lower score omitted the items which had no corresponding items in the other instruments (ie the utility of these items were set equal to 1.00 = best outcome). These items are shown by the arrows. In both case studies ‘removing’ these items largely bridges the difference between the instrument scores, with AQoL rising from 0.14 to 0.49 in Case Study 1 and HUI 3 rising from 0.14 to 0.74 in Case Study 2. In these cases content validity, not the method of scoring or choice of scaling instrument, explained most of the difference in the results.
The AQoL-4D measures 1.07 billion health states which is a very small subset of the number of health states defined by AQoL-8D. (Many are improbable, eg being blind, deaf, bedridden, full of energy and in control of your life!) These health states cannot all be measured individually and MAU instruments (except for the Rosser-Kind Index) model utility scores from a limited number of observations. To date, most instruments have adopted an additive model in which the disutility associated with each response from each item is independently measured, and the overall disutility estimated or modelled as a weighted average of these disutilities, where the weights are also obtained empirically during the scaling survey. This additive model is probably invalid (at least in theory as distinct from its practical application over a limited range of observations). For example a person encountering problems with independent living ‘IL’, but no other significant problems might experience a significant loss of utility – say 0.2 or a quarter of their utility. However a person who is bedridden, with a score of only 0.2 is unlikely to lose the full 0.2 when the effects of IL are included in the calculation. This may plausibly reduce the net utility by 20 percent of the previous score of 0.2 (ie to 0.16) but not to a utility of equivalent to death. This suggests the superiority of the multiplicative model employed by the HUI and AQoL instruments which reduces utilities (more or less) in percentage terms (Richardson, Hawthorne et al. 1998). However there is no certainty that even this more flexible model does not introduce significant estimation bias. In sum, the validation of MAU instruments should be regarded as work in progress. At present, progress is exceedingly slow.
Validating scaling techniques such as the TTO or SG is problematical as it is difficult to observe actual trade-offs between the quality and length of life which correspond with the trade-offs implied by the various scaling instruments. Some have argued that the standard gamble should be regarded as the gold standard for utility measurement as its use assumes the axioms of von Neumann and Morgenstern. This appears to make the standard gamble results consistent with mainstream economic theory. However, the axioms have been shown to be empirically incorrect and theoretically defective (Schoemaker 1982; Richardson and Pope 2009). Because of this history there has been little discussion of the question ‘how should we evaluate utilities’ or, more generally, ‘how should we decide upon the measurement units used for QoL’. As used in CUA, ‘utility’ needs two interval properties:
Yes. For very poor health states it is appropriate to ask whether the person would prefer death than live any time in the health state. If so a Worse-than-Death TTO question is asked: would you choose (i) death; or (ii) n years in the health state and (10-n) years full health. If ‘indifference’ – indecision – occurs when n = 10 then death is equivalent to the health state. If n = 2 then 8 years of full health is needed (as compensation) to make 2 years in the health state equivalent to death, ie the state is worse than death. As n decreases – more compensation is needed – the worse than death state gets worse. Placing a numerical value on these states, however, is difficult. If a person refused even one day in the health state followed by 10 years of full health the implied numerical value of the health state is minus infinity. This problem is discussed at length in Richardson and Hawthorne (2001) and various options are discussed and their numerical implications demonstrated. The use of lower value of -1.00 on utilities to achieve ‘symmetry’ with the upper value of 1.00 (the rationale offered in the EQ5D) is logically invalid as the meaning of the units changes at 0.00. The final algorithm suggested for the calculation of utilities transforms negative scores in such a way that the lower boundary is U = -0.25; that is, there is a disutility of 1.25. Interview methodology is presented in detail in Iezzi and Richardson (2009). Measuring Quality of Life at the Centre for Health Economics. Melbourne, Monash University.
Validity of the AQoL Instruments
Existing instruments do not correlate highly with each other (see Do MAU instruments correlate). This is indicative of the fact that the content validity of the major instruments has not been satisfactorily researched and different instruments are measuring differing QoL domains. Most rely upon face validity which is an unsatisfactory basis for measurement (see Face validity) and convergent validity which is a weak and context specific test for the validity of an MAU instrument (see Validating MAU instruments). This implies that existing instruments are being used in a way which systematically favours some interventions (where instruments have higher content validity) over other interventions where they have lower content validity. The extent of the differences in the performance of instruments in various disease areas is unknown as researches have used the weak evidence of convergent validity in one context to assert that instruments are ‘validated’, implying a generality of validity for use in economic analysis which is not justified (see Does correlation demonstrate validity).
This includes two separate issues.
Validating scaling techniques such as the TTO or SG is problematical as it is difficult to observe actual trade-offs between the quality and length of life which correspond with the trade-offs measured by the various scaling instruments. Consequently, validity has been determined primarily by face validity. Some have argued that the standard gamble should be regarded as the gold standard for utility measurement as its use assumes the axioms of von Neumann and Morgenstern. This appears to make the standard gamble results consistent with mainstream economic theory. However, as the axioms have been shown to be empirically incorrect and theoretically defective (Schoemaker 1982; Richardson and Pope 2009), rather, for the reasons outlined by Richardson (1994) and Dolan et al (1996), we have accepted the time trade off as having the greatest prima facie validity.
How is an MAU validated? This question cannot be answered with a simple ‘yes’ or ‘no’ and this is also true for other instruments despite the common and misleading statement that ‘instrument x has been validated’. Validity is a complex issue and the validation of MAU instruments has been very limited in scope. Four types of evidence increase confidence in the validity of an instrument, ie in confidence that it measures what we want it to measure (see Have MAU instruments been validated satisfactorily).
Conclusion, Glossary and References
In sum, correlation in one context is an insufficient test of validity in another context. It cannot relieve the researcher of the responsibility for ensuring that an instrument is capable of measuring the outcomes of relevance.
Content validity: Is defined as how well an instrument’s items may be considered to be a representative sample of the universe which the researcher is trying to measure. In HRQoL measurement this might be the extent to which the items in an instrument cover the full domain of HRQoL; that is, whether or not the instrument includes items which enquire about each of the dimensions of health that are included in the underlying concept of HRQoL. Where content validity is determined by looking at the instrument this is described as face validity. Although popular, apparent face validity does not confer content validity. Construct validity: Construct validity subsumes content validity. It indicates whether or not instrument items truly represent the underlying construct that is of interest. If the construct is correctly represented by the instrument it is possible to draw a succession of inferences from the instrument concerning instrument scores in different contexts. Construct validity therefore involves an ongoing process of testing the instrument in different contexts. Criterion validity: This describes the relationship between an instrument’s scores and either other independent measures (the criterion) or other specific measures (predictors), where the criteria or predictors are the gold standard for the measurement (e.g. in the case of breast cancer, the gold standard is the histopathological confirmation of cancer). In the absence of a gold standard, confidence in criterion validity increases if the instrument has high correlation with each of the accepted extant instruments. This is a necessary but not sufficient condition for criterion validity.
Dolan, P., C. Gudex, et al. (1996). ‘Valuing health states: A comparison of methods.’ Journal of Health Economics 15: 209-231. Fryback, D.G., M. Palta, et al. (2010). ‘Comparison of 5 Health Related Qof Life indexes using Item Response Theory analysis.’ Medical Decision Making 30(1): 5-15. Hawthorne, G., J. Richardson, et al. (2001). ‘A comparison of the Assessment of Quality of Life (AQoL) with four other generic utility instruments.’ Annals of Medicine 33: 358-370. Iezzi, A., and J. Richardson. (2009). Measuring Quality of Life at the Centre for Health Economics, Research Paper 41, Centre for Health Economics, Melbourne: Monash University. Richardson, J. (1994). ‘Cost utility analysis: What should be measured.’ Social Science & Medicine 39(1): 7-21. Richardson, J., G. Hawthorne, et al. (1998). Difficulty with Life and Death: Methodological Issues and Results from Utility Scaling of the Assessment of Quality of Life (AQoL) Instrument, Working Paper 70, Centre for Health Program Evaluation, Melbourne: Monash University. Richardson, J., G. Hawthorne, et al. (2001). Negative utilities and the evaluation of complex health states: Issues arising from the scaling of a Multi Attribute Utility Instrument, Working Paper 113, Centre for Health Program Evaluation, Melbourne: Monash University. Richardson, J. and R. Pope. (2009). The Invalidity of Expected Utility Theory and its misuse in the Economic Evaluation of Health and Safety, Research Paper 36, Centre for Health Economics, Monash University, Melbourne. (Forthcoming in (ed) M Schlander, Economic Evaluation of Health Care Programs: Current Concept , Controversies and International Experience, Springer: New York). Schoemaker, P. (1982). ‘The expected utility model: Its variants, purposes, evidence and limitations.’ Journal of Economic Literature XX: 529-563. Streiner, D. and G.R. Norman. (2003). Health Measurement Scales: A Practical Guide to their Development and Use. Oxford: Oxford University Press.
Please also see:
|
|